Robonomics + Prometheus + Grafana
The following instruction is provided by Hubo Bubo
The original article is located here
Introduction
To better monitor and maintain Robonomics node(s) it’s good to setup a monitoring based on Prometheus Server and Grafana. This doc will show how to configure each one of it to fully monitor your node.
Prerequisites
- Server Setup with Ubuntu 18.04
- Robonomics parachain collator installed
- Make sure you have robonomics.service working on your machine and port 9615 is reachable
Step 1 — Creating Service Users
For security purposes, we’ll begin by creating two new user accounts, prometheus and node_exporter. Create these two users, and use the –no-create-home and –shell /bin/false options so that these users can’t log into the server.
sudo useradd --no-create-home --shell /bin/false prometheus
sudo useradd --no-create-home --shell /bin/false node_exporter
Before we download the Prometheus binaries, create the necessary directories for storing Prometheus’ files and data. Following standard Linux conventions, we’ll create a directory in /etc for Prometheus’ configuration files and a directory in /var/lib for its data.
sudo mkdir /etc/prometheus
sudo mkdir /var/lib/prometheus
Now, set the user and group ownership on the new directories to the prometheus user.
sudo chown prometheus:prometheus /etc/prometheus
sudo chown prometheus:prometheus /var/lib/prometheus
Step 2 — Downloading Prometheus
First, download and unpack the current stable version of Prometheus into your home directory. You can find the latest binaries on the Prometheus download page.
wget https://github.com/prometheus/prometheus/releases/download/v2.21.0/prometheus-2.21.0.linux-amd64.tar.gz
Now, unpack the downloaded archive.
tar xvf prometheus-2.21.0.linux-amd64.tar.gz
This will create a directory called prometheus-2.21.0.linux-amd64 containing two binary files (prometheus and promtool), consoles and console_libraries directories containing the web interface files, a license, a notice, and several example files.
Copy the two binaries to the /usr/local/bin directory.
sudo cp prometheus-2.21.0.linux-amd64/prometheus /usr/local/bin/
sudo cp prometheus-2.21.0.linux-amd64/promtool /usr/local/bin/
Set the user and group ownership on the binaries to the prometheus user created in Step 1.
sudo chown prometheus:prometheus /usr/local/bin/prometheus
sudo chown prometheus:prometheus /usr/local/bin/promtool
Copy the consoles and console_libraries directories to /etc/prometheus.
sudo cp -r prometheus-2.21.0.linux-amd64/consoles /etc/prometheus
sudo cp -r prometheus-2.21.0.linux-amd64/console_libraries /etc/prometheus
Set the user and group ownership on the directories to the prometheus user. Using the -R flag will ensure that ownership is set on the files inside the directory as well.
sudo chown -R prometheus:prometheus /etc/prometheus/consoles
sudo chown -R prometheus:prometheus /etc/prometheus/console_libraries
Now that Prometheus is installed, we’ll create its configuration and service files in preparation of its first run.
Step 3 — Configuring Prometheus
In the /etc/prometheus directory, use nano or your favorite text editor to create a configuration file named prometheus.yml.
sudo nano /etc/prometheus/prometheus.yml
In the global settings, define the default interval for scraping metrics. Note that Prometheus will apply these settings to every exporter unless an individual exporter’s own settings override the globals.
global:
  scrape_interval: 15s
This scrape_interval value tells Prometheus to collect metrics from its exporters every 15 seconds, which is long enough for most exporters.
Now, add Prometheus itself to the list of exporters to scrape from with the following scrape_configs directive:
...
scrape_configs:
  - job_name: 'prometheus'
    scrape_interval: 5s
    static_configs:
      - targets: ['localhost:9090']
Prometheus uses the job_name to label exporters in queries and on graphs, so be sure to pick something descriptive here.
And, as Prometheus exports important data about itself that you can use for monitoring performance and debugging, we’ve overridden the global scrape_interval directive from 15 seconds to 5 seconds for more frequent updates.
Lastly, Prometheus uses the static_configs and targets directives to determine where exporters are running. Since this particular exporter is running on the same server as Prometheus itself, we can use localhost instead of an IP address along with the default port, 9090.
Your configuration file should now look like this:
global:
  scrape_interval: 15s

scrape_configs:
  - job_name: 'prometheus'
    scrape_interval: 5s
    static_configs:
      - targets: ['localhost:9090']
Save the file and exit your text editor.
Now, set the user and group ownership on the configuration file to the prometheus user created in Step 1.
sudo chown prometheus:prometheus /etc/prometheus/prometheus.yml
With the configuration complete, we’re ready to test Prometheus by running it for the first time.
Step 4 — Running Prometheus
Start up Prometheus as the prometheus user, providing the path to both the configuration file and the data directory.
sudo -u prometheus /usr/local/bin/prometheus \
    --config.file /etc/prometheus/prometheus.yml \
    --storage.tsdb.path /var/lib/prometheus/ \
    --web.console.templates=/etc/prometheus/consoles \
    --web.console.libraries=/etc/prometheus/console_libraries
The output contains information about Prometheus’ loading progress, configuration file, and related services. It also confirms that Prometheus is listening on port 9090.
_log output_
Sep 14 17:55:53 robonomics systemd[1]: Started Prometheus.
Sep 14 17:55:53 robonomics prometheus[29488]: level=info ts=2020-09-14T15:55:53.347Z caller=main.go:310 msg="No time or size retention was set so using the default time retention" duration=15d
Sep 14 17:55:53 robonomics prometheus[29488]: level=info ts=2020-09-14T15:55:53.350Z caller=main.go:346 msg="Starting Prometheus" version="(version=2.21.0, branch=HEAD, revision=e83ef207b6c2398919b69cd87d2693cfc2fb4127)"
Sep 14 17:55:53 robonomics prometheus[29488]: level=info ts=2020-09-14T15:55:53.351Z caller=main.go:347 build_context="(go=go1.15.2, user=root@a4d9bea8479e, date=20200911-11:35:02)"
Sep 14 17:55:53 robonomics prometheus[29488]: level=info ts=2020-09-14T15:55:53.351Z caller=main.go:348 host_details="(Linux 4.15.0-112-generic #113-Ubuntu SMP Thu Jul 9 23:41:39 UTC 2020 x86_64 robonomics (none))"
Sep 14 17:55:53 robonomics prometheus[29488]: level=info ts=2020-09-14T15:55:53.351Z caller=main.go:349 fd_limits="(soft=1024, hard=4096)"
Sep 14 17:55:53 robonomics prometheus[29488]: level=info ts=2020-09-14T15:55:53.351Z caller=main.go:350 vm_limits="(soft=unlimited, hard=unlimited)"
Sep 14 17:55:53 robonomics prometheus[29488]: level=info ts=2020-09-14T15:55:53.357Z caller=main.go:701 msg="Starting TSDB ..."
Sep 14 17:55:53 robonomics prometheus[29488]: level=info ts=2020-09-14T15:55:53.368Z caller=web.go:523 component=web msg="Start listening for connections" address=0.0.0.0:9090
Sep 14 17:55:53 robonomics prometheus[29488]: level=info ts=2020-09-14T15:55:53.372Z caller=head.go:644 component=tsdb msg="Replaying on-disk memory mappable chunks if any"
Sep 14 17:55:53 robonomics prometheus[29488]: level=info ts=2020-09-14T15:55:53.373Z caller=head.go:658 component=tsdb msg="On-disk memory mappable chunks replay completed" duration=12.659µs
Sep 14 17:55:53 robonomics prometheus[29488]: level=info ts=2020-09-14T15:55:53.373Z caller=head.go:664 component=tsdb msg="Replaying WAL, this may take a while"
Sep 14 17:55:53 robonomics prometheus[29488]: level=info ts=2020-09-14T15:55:53.380Z caller=head.go:716 component=tsdb msg="WAL segment loaded" segment=0 maxSegment=1
Sep 14 17:55:53 robonomics prometheus[29488]: level=info ts=2020-09-14T15:55:53.381Z caller=head.go:716 component=tsdb msg="WAL segment loaded" segment=1 maxSegment=1
Sep 14 17:55:53 robonomics prometheus[29488]: level=info ts=2020-09-14T15:55:53.381Z caller=head.go:719 component=tsdb msg="WAL replay completed" checkpoint_replay_duration=48.125µs wal_replay_duration=8.253748ms total_replay_duration=8.343335ms
Sep 14 17:55:53 robonomics prometheus[29488]: level=info ts=2020-09-14T15:55:53.383Z caller=main.go:721 fs_type=EXT4_SUPER_MAGIC
Sep 14 17:55:53 robonomics prometheus[29488]: level=info ts=2020-09-14T15:55:53.384Z caller=main.go:724 msg="TSDB started"
Sep 14 17:55:53 robonomics prometheus[29488]: level=info ts=2020-09-14T15:55:53.384Z caller=main.go:850 msg="Loading configuration file" filename=/etc/prometheus/prometheus.yml
Sep 14 17:55:53 robonomics prometheus[29488]: level=info ts=2020-09-14T15:55:53.384Z caller=main.go:881 msg="Completed loading of configuration file" filename=/etc/prometheus/prometheus.yml totalDuration=908.135µs remote_storage=6.693µs web_handler=819ns query_engine=1.383µs scrape=400.232µs scrape_sd=41.679µs notify=1.1µs notify_sd=1.847µs rules=1.522µs
Sep 14 17:55:53 robonomics prometheus[29488]: level=info ts=2020-09-14T15:55:53.384Z caller=main.go:673 msg="Server is ready to receive web requests."
If you get an error message, double-check that you’ve used YAML syntax in your configuration file and then follow the on-screen instructions to resolve the problem.
Now, halt Prometheus by pressing CTRL+C, and then open a new systemd service file.
sudo nano /etc/systemd/system/prometheus.service
The service file tells systemd to run Prometheus as the prometheus user, with the configuration file located in the /etc/prometheus/prometheus.yml directory and to store its data in the /var/lib/prometheus directory.Copy the following content into the file:
[Unit]
Description=Prometheus
Wants=network-online.target
After=network-online.target

[Service]
User=prometheus
Group=prometheus
Type=simple
ExecStart=/usr/local/bin/prometheus \
    --config.file /etc/prometheus/prometheus.yml \
    --storage.tsdb.path /var/lib/prometheus/ \
    --web.console.templates=/etc/prometheus/consoles \
    --web.console.libraries=/etc/prometheus/console_libraries

[Install]
WantedBy=multi-user.target
Finally, save the file and close your text editor. To use the newly created service, reload systemd.
sudo systemctl daemon-reload
You can now start Prometheus using the following command:
sudo systemctl start prometheus
To make sure Prometheus is running, check the service’s status.
sudo systemctl status prometheus
The output tells you Prometheus’ status, main process identifier (PID), memory use, and more.
If the service’s status isn’t active, follow the on-screen instructions and re-trace the preceding steps to resolve the problem before continuing the tutorial.
* prometheus.service - Prometheus
   Loaded: loaded (/etc/systemd/system/prometheus.service; enabled; vendor preset: enabled)
   Active: active (running) since Mon 2020-09-14 17:59:48 CEST; 24h ago
 Main PID: 29650 (prometheus)
    Tasks: 9 (limit: 4915)
   CGroup: /system.slice/prometheus.service
           `-29650 /usr/local/bin/prometheus --config.file /etc/prometheus/prometheus.yml --storage.tsdb.path /var/lib/prometheus/ --web.console.templates=/etc/prometheus/consoles --web.console.libraries=/etc/prometheus/console_libraries
When you’re ready to move on, press Q to quit the status command. Lastly, enable the service to start on boot.
sudo systemctl enable prometheus
Now that Prometheus is up and running, we can install an additional exporter to generate metrics about our server’s resources.
Step 5 — Downloading Node Exporter
To expand Prometheus beyond metrics about itself only, we’ll install an additional exporter called Node Exporter. Node Exporter provides detailed information about the system, including CPU, disk, and memory usage. Download the current stable version of Node Exporter into your home directory. You can find the latest binaries on Prometheus download page.
wget https://github.com/prometheus/node_exporter/releases/download/v1.0.1/node_exporter-1.0.1.linux-amd64.tar.gz
Now, unpack the downloaded archive.
tar xvf node_exporter-1.0.1.linux-amd64.tar.gz
This will create a directory called node_exporter-1.0.1.linux-amd64 containing a binary file named node_exporter, a license, and a notice.
Copy the binary to the /usr/local/bin directory and set the user and group ownership to the node_exporter user that you created in Step 1.
sudo cp node_exporter-1.0.1.linux-amd64/node_exporter /usr/local/bin
sudo chown node_exporter:node_exporter /usr/local/bin/node_exporter
Now that you’ve installed Node Exporter, let’s test it out by running it before creating a service file for it so that it starts on boot.
Step 6 — Running Node Exporter
The steps for running Node Exporter are similar to those for running Prometheus itself. Start by creating the Systemd service file for Node Exporter.
sudo nano /etc/systemd/system/node_exporter.service
Copy the following content into the service file:
[Unit]
Description=Node Exporter
Wants=network-online.target
After=network-online.target

[Service]
User=node_exporter
Group=node_exporter
Type=simple
ExecStart=/usr/local/bin/node_exporter --collector.systemd

[Install]
WantedBy=multi-user.target
Save the file and close your text editor. Finally, reload systemd to use the newly created service.
sudo systemctl daemon-reload
You can now run Node Exporter using the following command:
sudo systemctl start node_exporter
Verify that Node Exporter’s running correctly with the status command.
sudo systemctl status node_exporter
Like before, this output tells you Node Exporter’s status, main process identifier (PID), memory usage, and more. If the service’s status isn’t active, follow the on-screen messages and re-trace the preceding steps to resolve the problem before continuing.
_Output_
* node_exporter.service - Node Exporter
   Loaded: loaded (/etc/systemd/system/node_exporter.service; enabled; vendor preset: enabled)
   Active: active (running) since Mon 2020-09-14 17:58:25 CEST; 1 day 1h ago
 Main PID: 29612 (node_exporter)
    Tasks: 7 (limit: 4915)
   CGroup: /system.slice/node_exporter.service
           `-29612 /usr/local/bin/node_exporter --collector.systemd
Lastly, enable Node Exporter to start on boot.
sudo systemctl enable node_exporter
With Node Exporter fully configured and running as expected, we’ll tell Prometheus to start scraping the new metrics.
Step 7 — Configuring Prometheus to Scrape Node Exporter
Because Prometheus only scrapes exporters which are defined in the scrape_configs portion of its configuration file, we’ll need to add an entry for Node Exporter, just like we did for Prometheus itself. Open the configuration file.
sudo nano /etc/prometheus/prometheus.yml
At the end of the scrape_configs block, add a new entry called node_exporter.
...
  - job_name: 'node_exporter'
    scrape_interval: 5s
    static_configs:
      - targets: ['localhost:9100']
Because this exporter is also running on the same server as Prometheus itself, we can use localhost instead of an IP address again along with Node Exporter’s default port, 9100. Your whole configuration file should look like this:
global:
  scrape_interval: 15s

scrape_configs:
  - job_name: 'prometheus'
    scrape_interval: 5s
    static_configs:
      - targets: ['localhost:9090']
  - job_name: 'node_exporter'
    scrape_interval: 5s
    static_configs:
      - targets: ['localhost:9100']
Save the file and exit your text editor when you’re ready to continue. Finally, restart Prometheus to put the changes into effect.
sudo systemctl restart prometheus
Once again, verify that everything is running correctly with the status command.
sudo systemctl status prometheus
If the service’s status isn’t set to active, follow the on screen instructions and re-trace your previous steps before moving on.
Output
* prometheus.service - Prometheus
   Loaded: loaded (/etc/systemd/system/prometheus.service; enabled; vendor preset: enabled)
   Active: active (running) since Tue 2020-09-15 19:06:56 CEST; 2s ago
 Main PID: 19725 (prometheus)
    Tasks: 8 (limit: 4915)
   CGroup: /system.slice/prometheus.service
           `-19725 /usr/local/bin/prometheus --config.file /etc/prometheus/prometheus.yml --storage.tsdb.path /var/lib/prometheus/ --web.console.templates=/etc/prometheus/consoles --web.console.libraries=/etc/prometheus/console_libraries
We now have Prometheus and Node Exporter installed, configured, and running.
Step 8 - Adding Robonomic build in node_exporter
After successfully installed Prometheus and node_exporter we will have to use build in prometheus exporter in every substrate project. To make this happen we have to add additional entry to /etc/prometheus/prometheus.yml.
Open the configuration file.
sudo nano /etc/prometheus/prometheus.yml
At the end of the scrape_configs block, add a new entry called robonomic_exporter.
  - job_name: 'robonomics_exporter'
    scrape_interval: 5s
    static_configs:
      - targets: ['localhost:9615']
Save the file and exit your text editor. Your whole configuration file should look like this:
global:
  scrape_interval: 15s

scrape_configs:
  - job_name: 'prometheus'
    scrape_interval: 5s
    static_configs:
      - targets: ['localhost:9090']
  - job_name: 'node_exporter'
    scrape_interval: 5s
    static_configs:
      - targets: ['localhost:9100']
  - job_name: 'robonomics_exporter'
    scrape_interval: 5s
    static_configs:
      - targets: ['localhost:9615']
Finally, restart Prometheus to put the changes into effect.
sudo systemctl restart prometheus
Once again, verify that everything is running correctly with the status command.
sudo systemctl status prometheus
We now have Prometheus and Node Exporter as well as Robonomic Exporter installed, configured, and running. Now move on to Grafana
Step 9 - Setting up Grafana
The last step is to connect Prometheus as a Data Source in Grafana. For purpose of this tutorial we will use free cloud-based grafana which allow to have up to 5 dashboards as well as dedicated Robonomics dashboard. Simply go to grafana.com create new account and login to your newly created grafana instance.
At the beginning we must add to Grafana new Data Source which in our case will be Prometheus server.
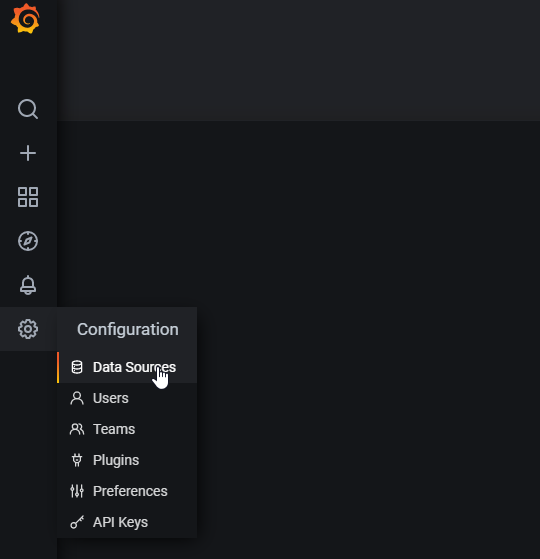
Go to Data Source:
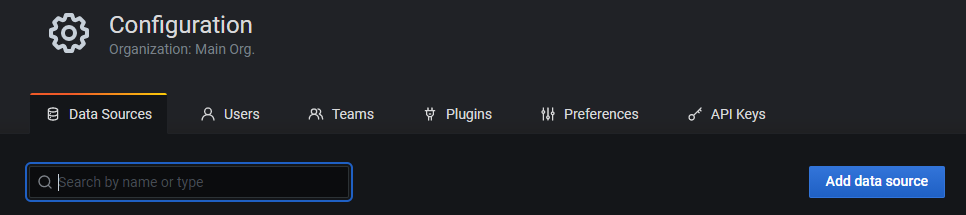
Then click Add data source
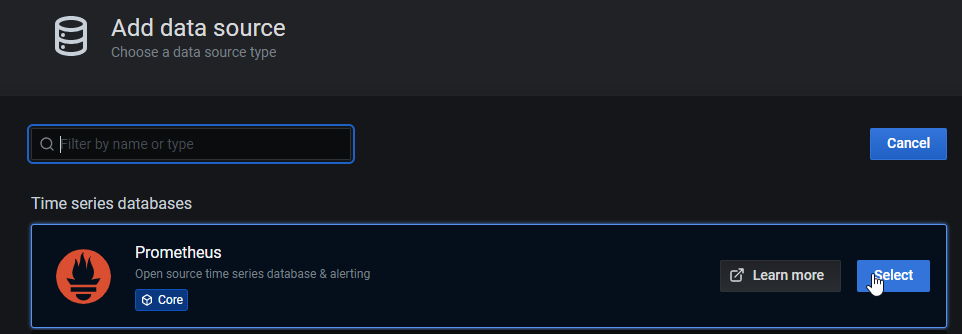
Next select Prometheus
In new screen put your Prometheus server IP adress with 9090 port
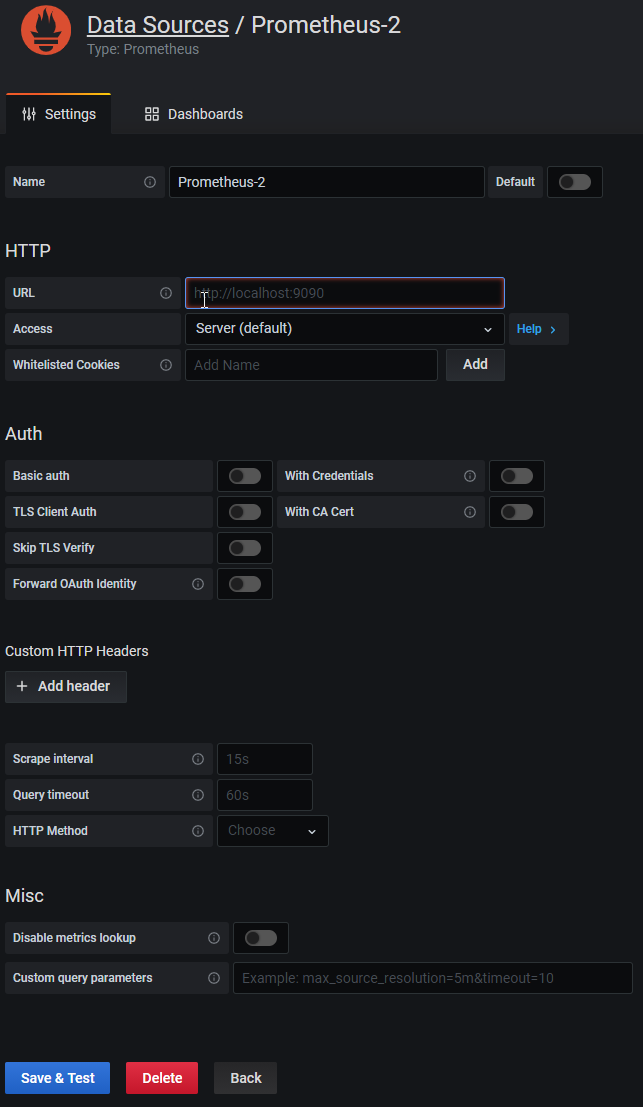
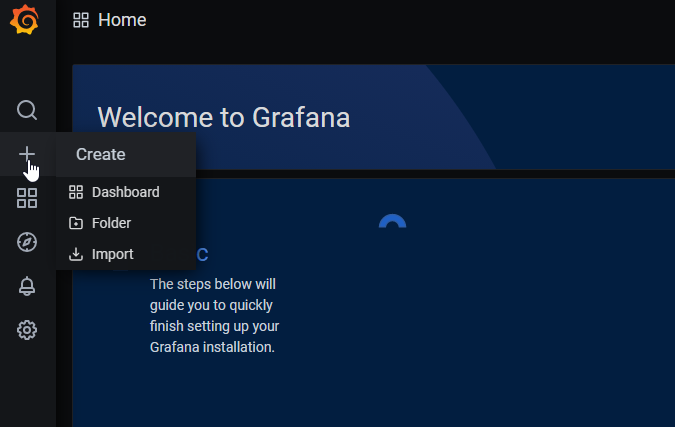
After that Save & Test if you did all steps you should be green and ready to go for importing dashboard. On the main site click to + and then Import as shown on the pic below:
Then you should see Import page:
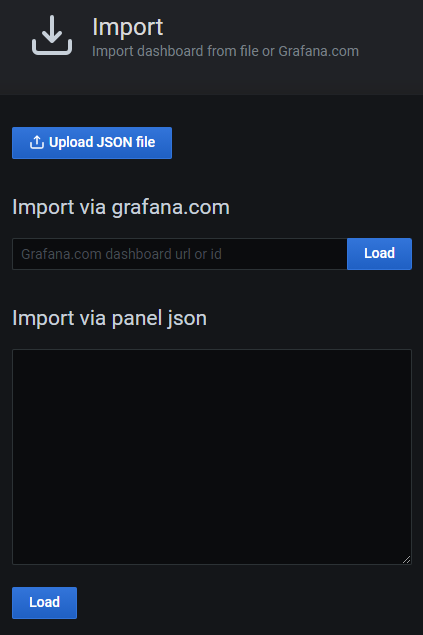
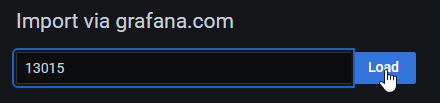
In the Grafana.com dashboard url or id write 13015 (as this is ID of the Robonomic dashboard)
After loading external dashboard you will get this screen:
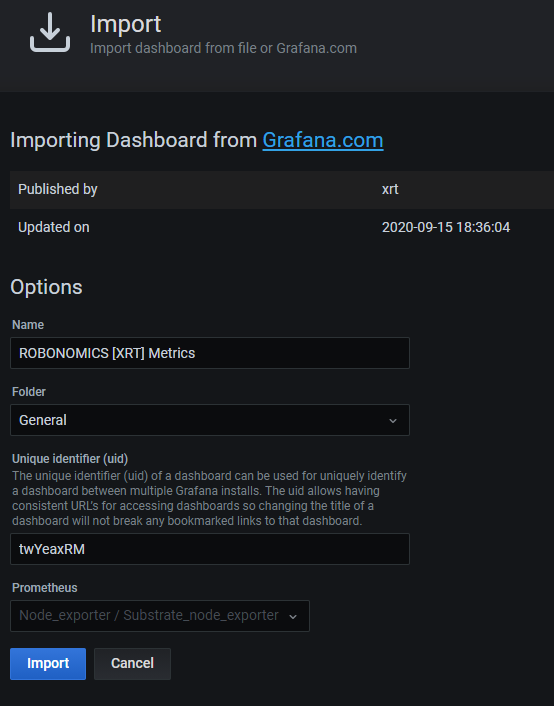
The last step is to choose previously created Data Source and click Import
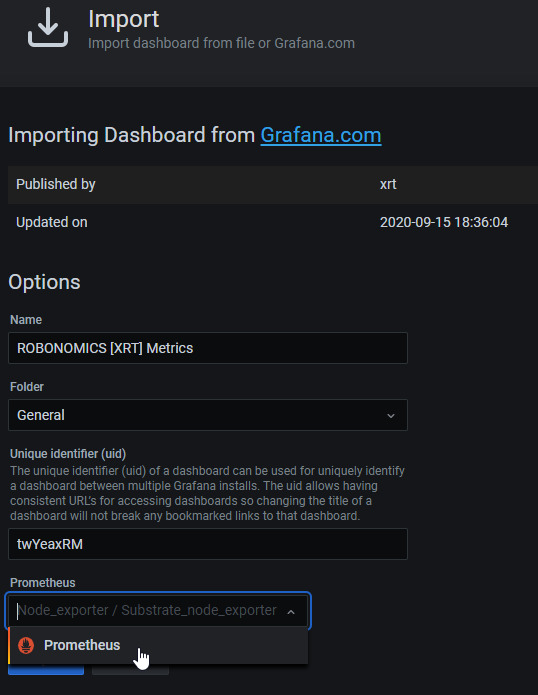
THAT’S IT ! At this point you should see imported dashboard.
References
- How To Install Prometheus on Ubuntu 16.04
- Build A Monitoring Dashboard by Prometheus + Grafana
- Grafana support for Prometheus
- Monitoring Linux host metrics with the node exporter
- Querying Prometheus
- Visualizing Node Metrics
- Substrate Prometheus Exporter
- polkadot-dashboard
- Polkadot node metric
- Node Exporter for Prometheus Dashboard
- Grafana ROBONOMICS (XRT) Metrics
Couldn't complete
It was hard
It was ok
It was easy
Make a contribution
Robonomics wiki is open source. See something that's wrong or unclear? Submit a pull request.